Authors: Caroline Appert, Simone Barbosa, Regan Mandryk
In Conference Finances and Format—Part One: Prior and Current Context, we described the financial and format constraints of CHI. Given those constraints, it is the CHI Steering Committee’s (SC) responsibility to evolve the CHI conference to offer a model that is both financially self-sustaining that allows for a better attendee experience with time for structured discussion and conferring.
In Part Two: Shaping the Future of CHI, we explored ways to address those constraints. In order to open the discussion with the community and assess the changes that the community is willing to make, we asked the community to comment on those proposals through both a survey and two Zoom sessions on shaping the future of CHI.
This blog post reports on the observations that we made.
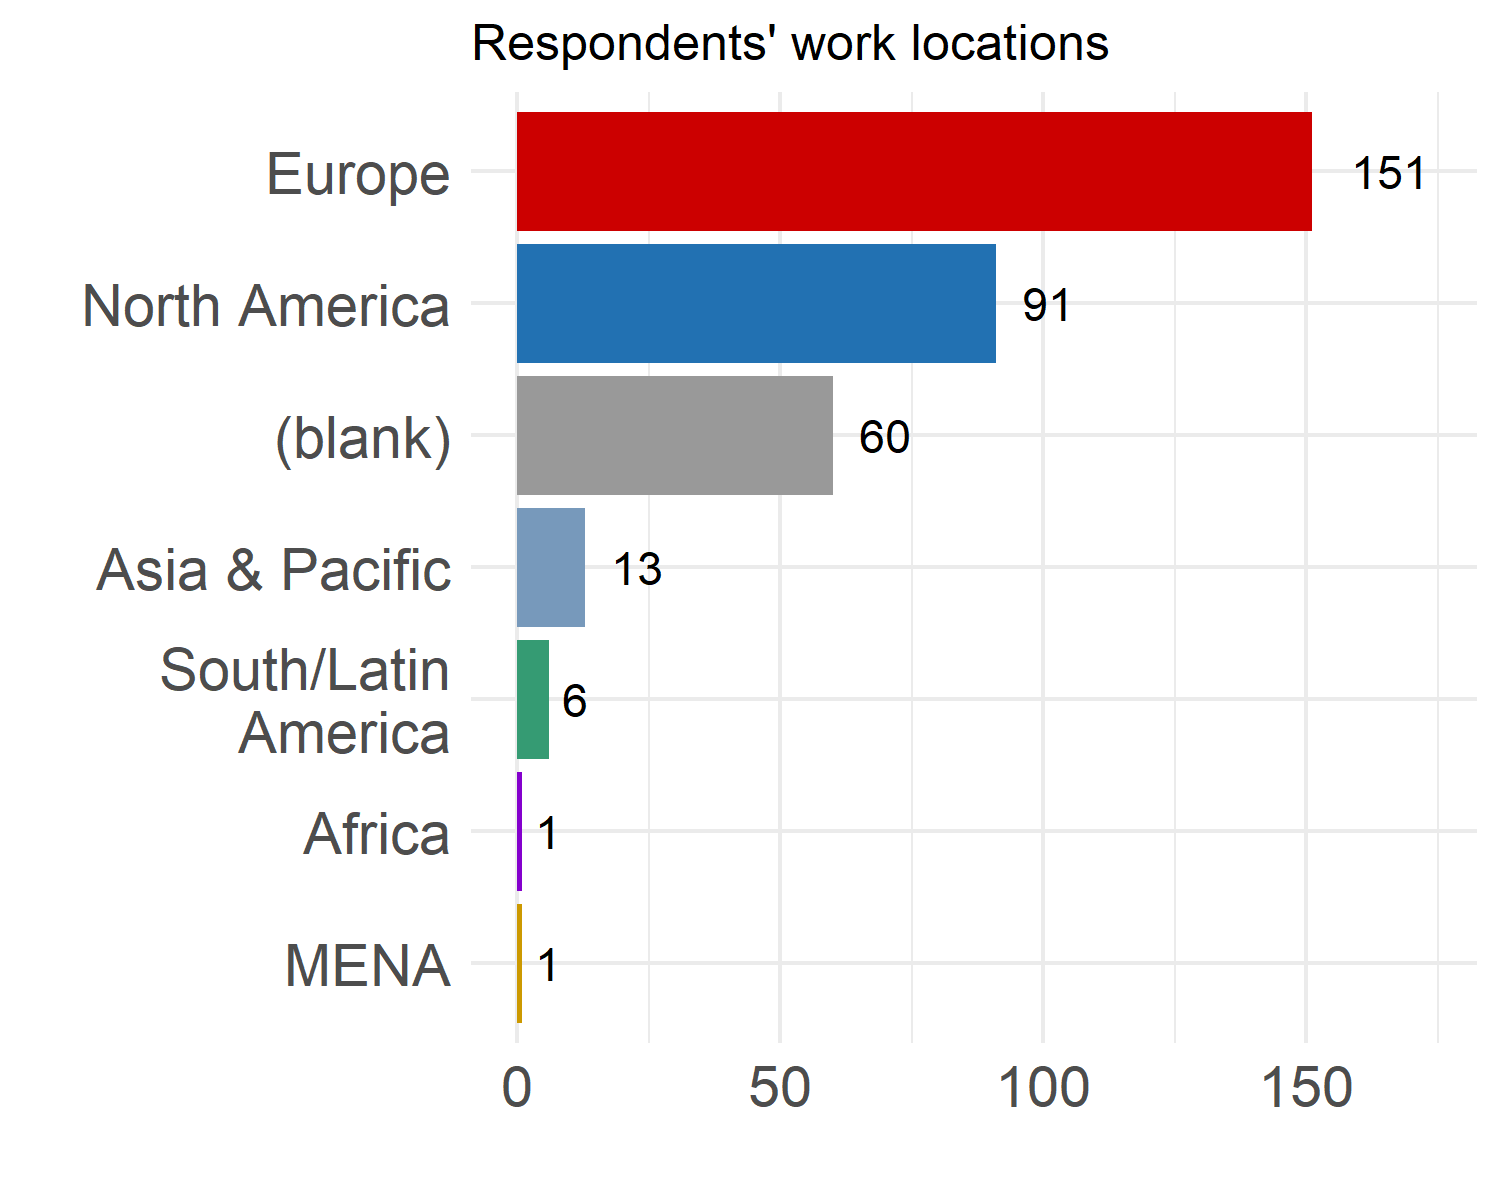
Over the two Zoom sessions, there were approximately 50 participants, primarily attending from North America, Europe, South America, Asia, and Australia. In the sessions members of the CHI SC gave a presentation of the history and current situation regarding the format and finances of CHI, and then described a series of proposed changes, asking for community feedback after each proposal. Finally, a time was allocated for asking for new ideas on addressing the challenges facing the CHI conference series.
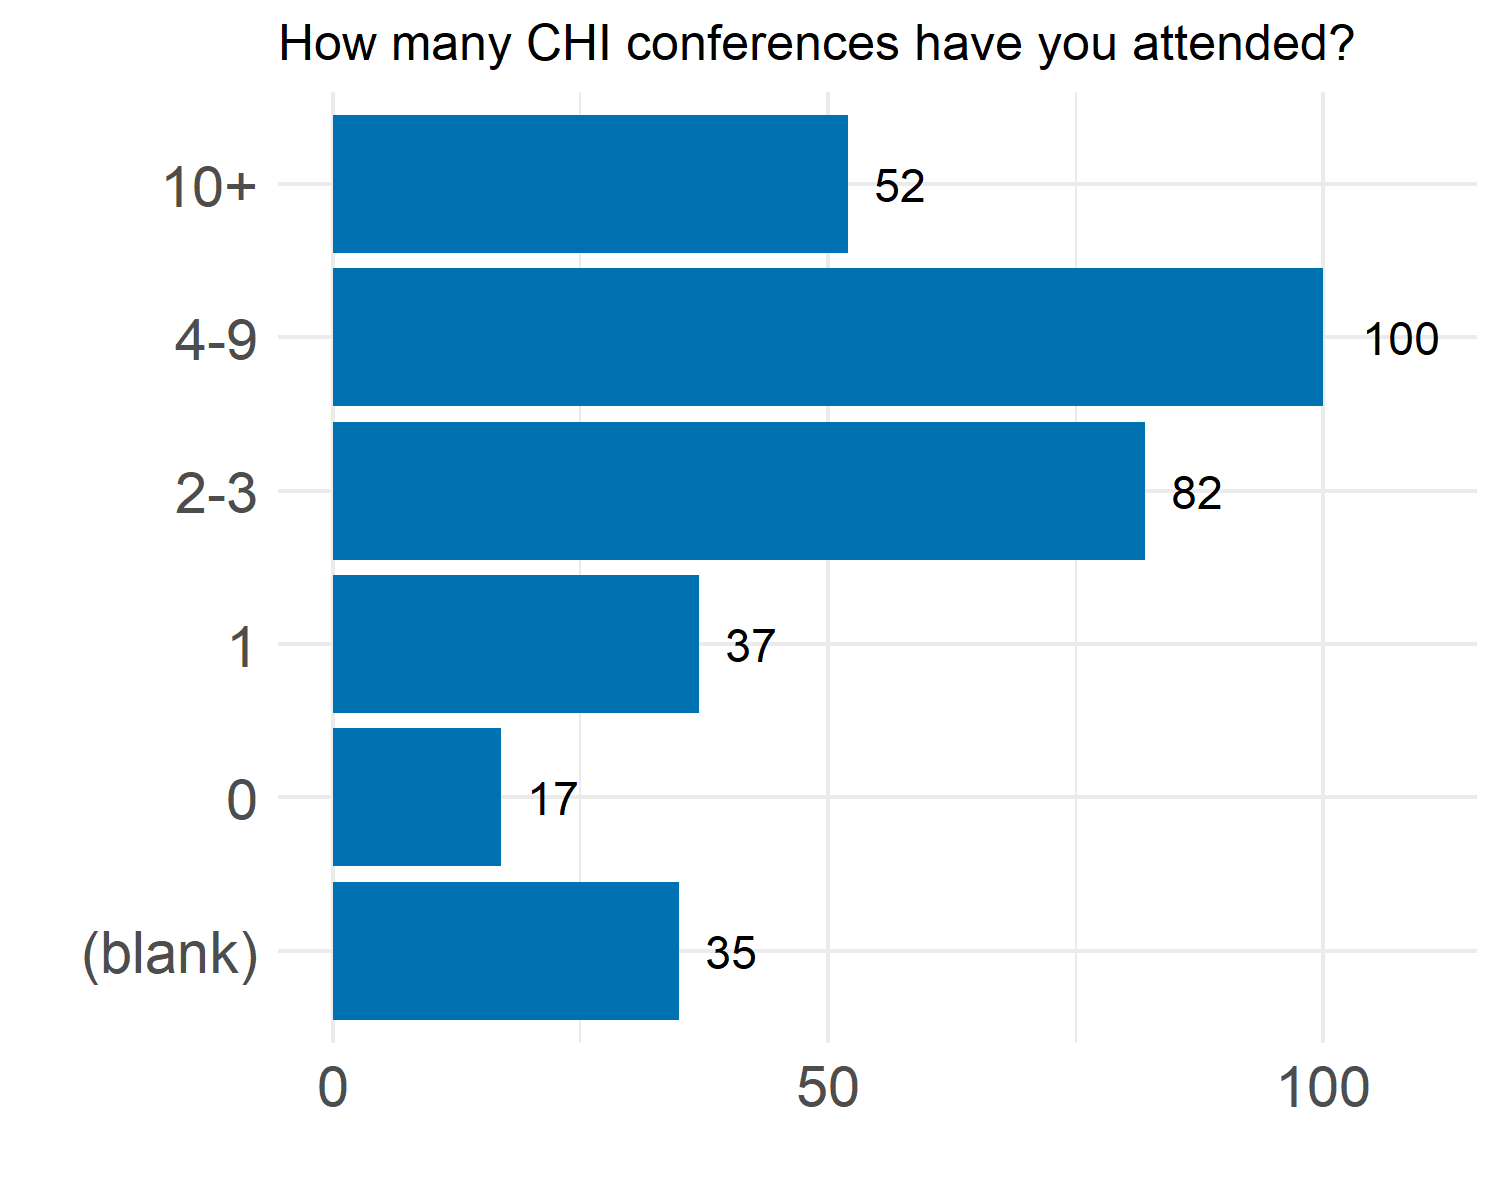
Overall, 323 persons took part in the survey. When interpreting the results reported below, it is important to keep in mind that this sample is relatively small in comparison with the community size (4,722 attendees for CHI ‘23). The geographic distribution of respondents and their CHI experience are reported in the two charts below. As 17 respondents stated not having yet attended a CHI conference, they were excluded from the subsequent analysis.
 |  |
The survey consisted of a series of proposals, each aligning with one the following three objectives: 1) increase participants’ time for conferring, 2) reduce the conference expenses or 3) increase the conference revenue. Survey participants were requested to express their level of support for each proposal by assigning a score between 0 (No support) and 10 (Full support). Respondents were also systematically invited to share open comments. In all charts below, the median (M) is used as a central measure of respondents’ scores.
1. Increase the time for conferring
1a. By changing the presentation format
Proposal: All papers give lightning talks, followed by parallelized discussion time in a ‘scrum’ format.
As illustrated above, respondents’ scores to this proposal were quite uniformly distributed over the full [0-10] range. In their open comments, respondents feared that the talks might become too short, resulting in a format that might be stressful for non-native English speakers who might need more time to convey important messages and some difficulties for attendees to absorb enough substantial content. Also note that we did not suggest a specific duration for the lightning talks, so participants’ assumptions about that may have increased the variability of their responses. In the Zoom sessions, participants were supportive of this proposal, but echoed concerns about the different type of ‘performance’ required in a short well-produced lightning talk.
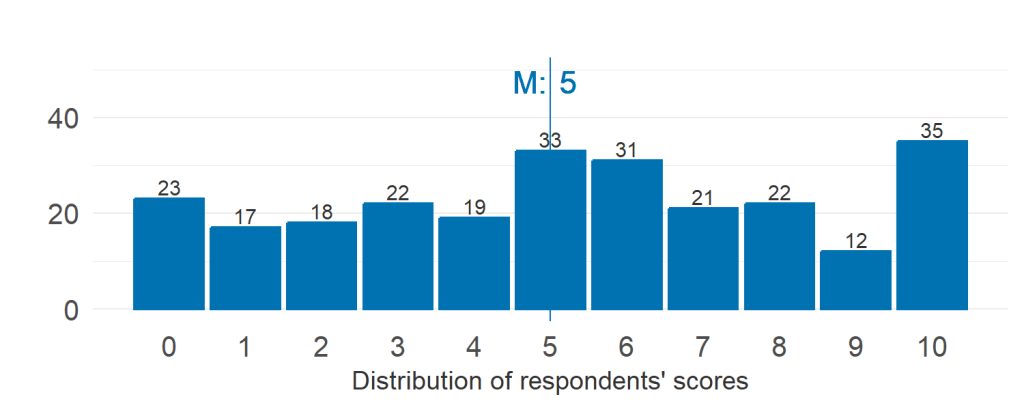
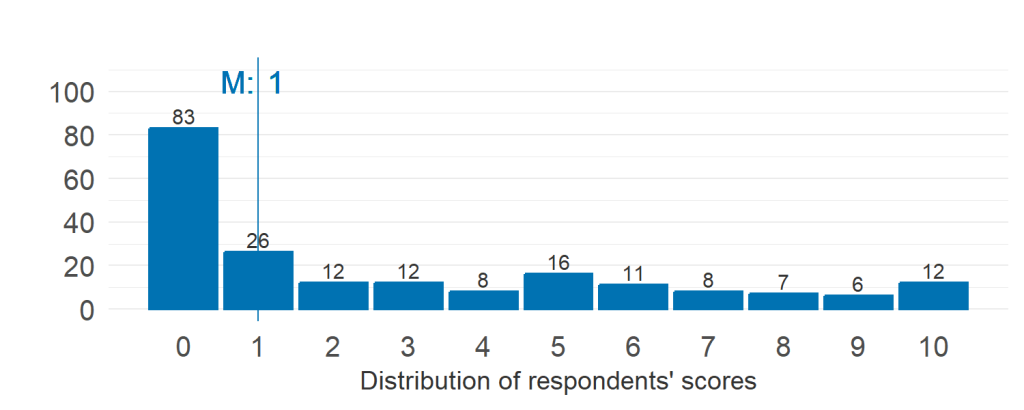
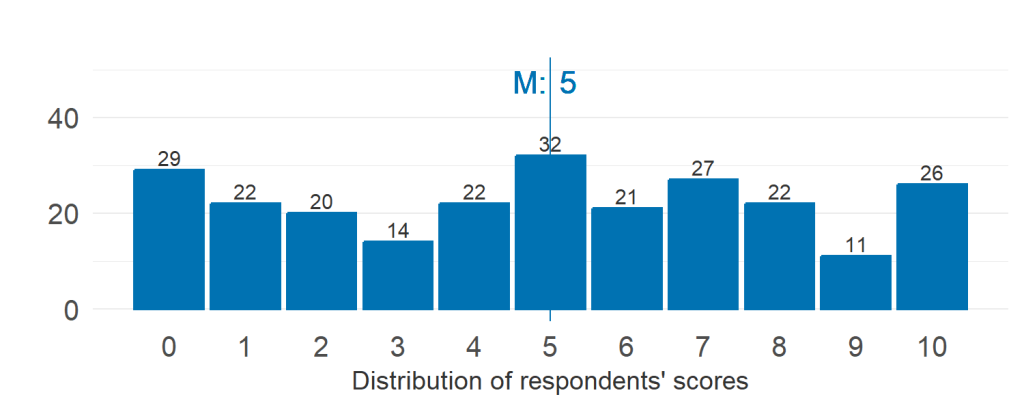
1b. By increasing the parallelization of the talks.
Proposal: We increase parallelization of the talks.
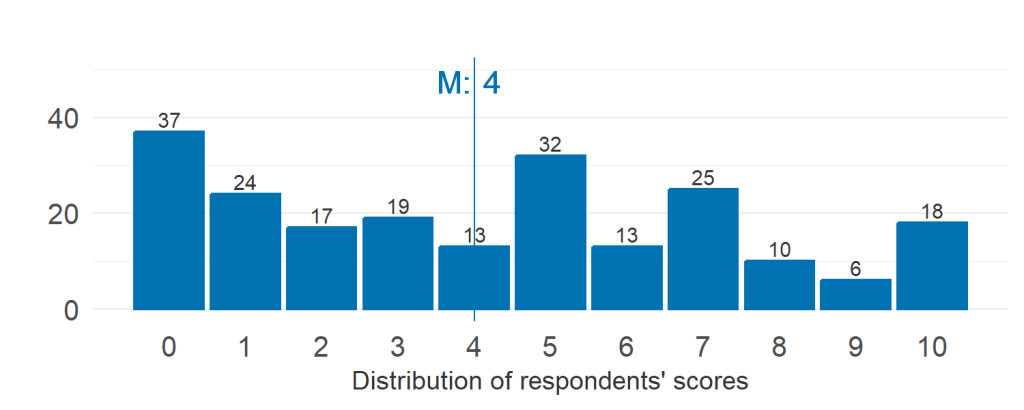
With a median of 4 and a distribution skewed towards more negative reactions than positive ones, we can infer that CHI has reached a level of parallelization that should not continue to increase. The detailed proposal suggested doubling the number of parallel sessions, which stirred some apprehension among respondents who deemed such an increase as unsustainable. Despite this, some respondents explicitly expressed a preference for this option over one where not all authors would have sufficient time to present at the conference. In the Zoom session, some participants noted that they had attended large conferences with highly parallel small paper sessions, and that the experience was not enjoyable for the presenters.
1c. By decreasing the number of presentations
The survey made a series of proposals that would decrease the number of presentations at the conference:
Proposal: We present only the top 5%–10% of papers as talks.
The other 90%-95% of the papers would be available to attendees either 1) as pre-recorded videos only or 2) as pre-recorded videos + posters.

Presenting the large majority of papers as videos only (Left) was very unpopular, with respondents being concerned about the almost zero value for authors to attend the conference. The possibility of complementing the video by a poster (Right) was slightly better perceived but raised concerns regarding the additional work it represents for authors for a limited exposure at the conference. But, most importantly, these two proposals caused negative reactions due to concerns related to the selection process of these “top papers” and the elitist atmosphere it would create at the conference. In the Zoom sessions, participants were also concerned about selection mechanisms for what would be considered as the “top papers”.
Proposal: We could accept only the top 5%–10% of papers as talks.
This even more radical proposal that would consist in drastically decreasing the acceptance rate was strongly rejected. Respondents argued that adopting an exceedingly low acceptance rate would introduce a considerable degree of randomness and inequities into the selection process. Respondents estimate that the selection would be decorrelated from the scientific quality of papers and would inherently reduce the diversity in papers accepted at CHI. Participants in the Zoom sessions were concerned about the effects on career development for more junior academics.
Proposal: We could limit the presentations by limiting the number of submissions per author or by instituting a submission fee.
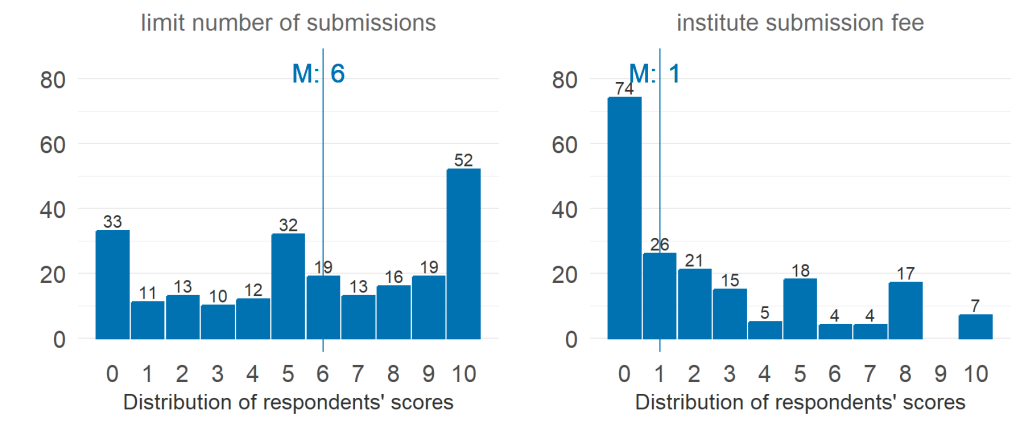
Although limiting the number of submissions per author (Left) was assessed slightly positively per respondents, the comments highlighted the risk of such a proposal to be unfair and potentially toxic for students in large groups and the difficulty of defining a criterion to define the limit. Instituting a submission fee (Right) was largely rejected by respondents mostly because of the equity concerns it would generate between well-funded groups and less well-funded groups.
2. Reducing expenses
2a. By removing exhibitors
Proposal: Remove the exhibitors
While a few respondents acknowledged that exhibitor booths might facilitate connections for young researchers with companies, a majority of respondents’ comments pointed at the limitations of an exhibit hall as an effective platform for companies to recruit researchers. The concerns raised also included the predominantly US-centric representation of companies and the perception that corporate interests often do not align with advancing scientific knowledge, which should remain the driving force of CHI. Participants in the Zoom sessions noted that exhibitor booths are not the only means of engaging with companies at CHI.
2b. By removing or reducing interactivity
Proposal: Remove or Reduce Interactivity
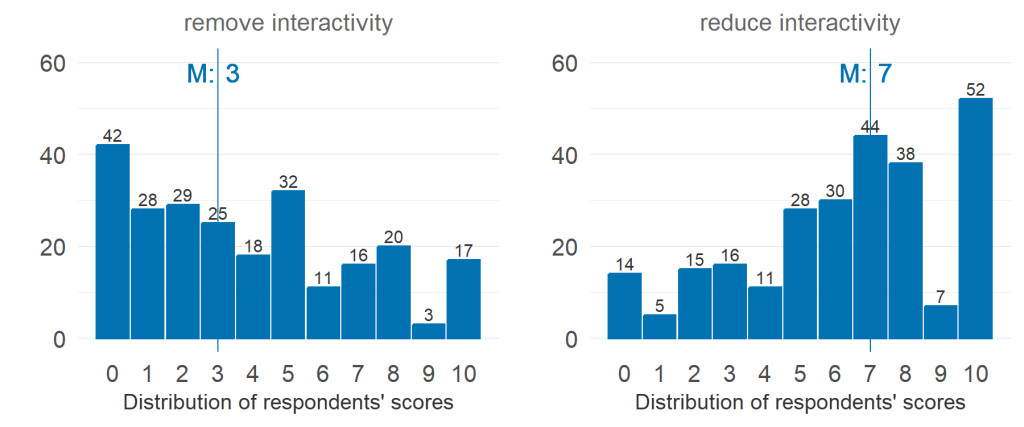
In general, respondents perceive Interactivity as a fundamental aspect of CHI, considering it an indispensable platform for engaging with cutting-edge technologies. Consequently, there was a tendency to dismiss the idea of eliminating the Interactivity venue altogether (Left). Instead, respondents leaned towards the proposal to scale down Interactivity (Right), advocating for a refinement of the curation process. Some respondents also suggested potentially showcasing fewer works through several sessions in smaller rooms. Participants in the Zoom sessions agreed.
2c. By reducing our geographical diversity
Proposal: Move to a new format in which either: 1) we meet physically every 2 years and virtually in between or 2) we rotate CHI around 2-4 known locations.
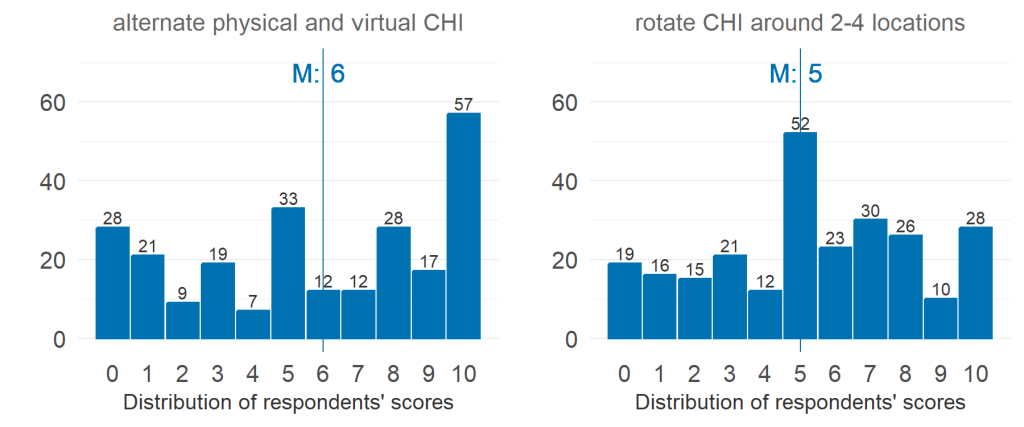
Respondents acknowledged the positive aspect of reducing our carbon footprint by having virtual CHI conferences every two years (Left). However, they also expressed concerns regarding the potential impact on students’ careers. Virtual conferences, compared to physical ones, were perceived as less efficient for students to present their work and engage with an international audience. This would be particularly detrimental to students in countries where PhD programs are limited to 3 years. The shift to a virtual format every two years could mean that such students would have only a single opportunity for such valuable exposure during their PhD. Regarding the proposal to rotate CHI around 2-4 established locations (Right), respondents’ scores were quite uniformly distributed and rather neutral on average. While it could be more practical if the locations are strategically chosen to facilitate access and create as less friction as possible (regarding e.g., visa concerns), it would privilege the same regions repeatedly. Numerous respondents advocated for a more dynamic approach, emphasizing the importance of regularly exploring new locations and periodically reassessing and diversifying venues over the long term. In the Zoom sessions, participants raised the possibility of regional meetups for people who live in areas in which there is more possibility for idea exchange in HCI, but also noted that many CHI attendees live and work in areas in which geography or lack of density in HCI researchers make this challenging. They further noted that it would reduce their opportunities to meet internationally with colleagues in their specific subdomain of HCI.
3. Increasing revenue
3a. By charging a submission fee or presentation fee
Proposal: Charge a submission fee and/or a presentation fee.
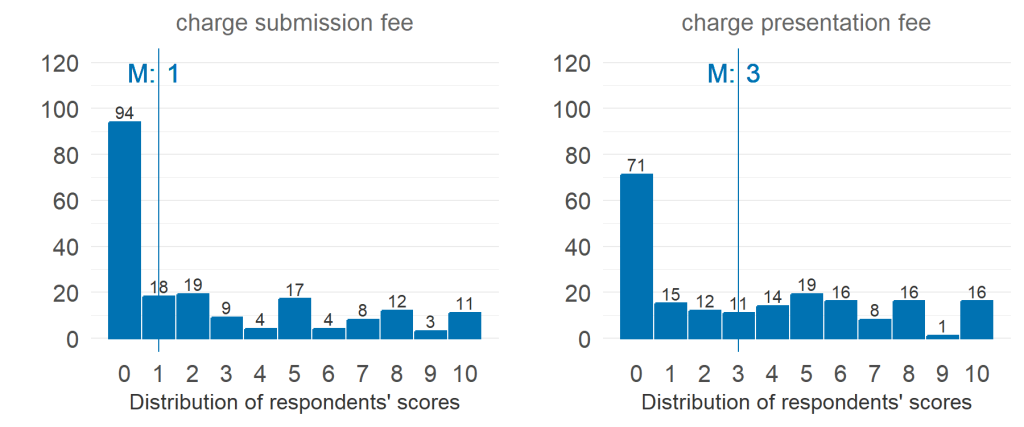
These two proposals were largely rejected by respondents, with a lot of comments raising the risk of increasing inequities. Respondents also mentioned that, if implemented, stringent criteria should be meticulously crafted to grant waivers to less privileged groups. This precautionary measure aims to address the potential difficulties these fees might pose for less privileged groups to access the conference.
3b. By securing more industry sponsors
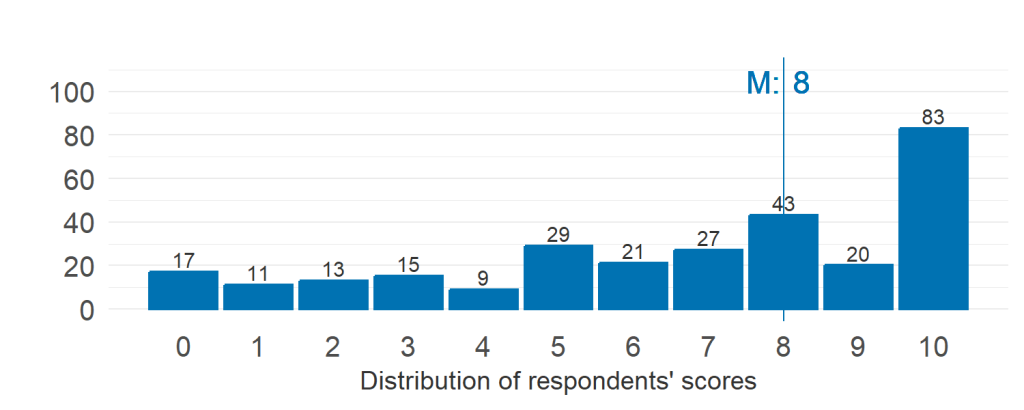
Proposal: Secure more industry sponsors.
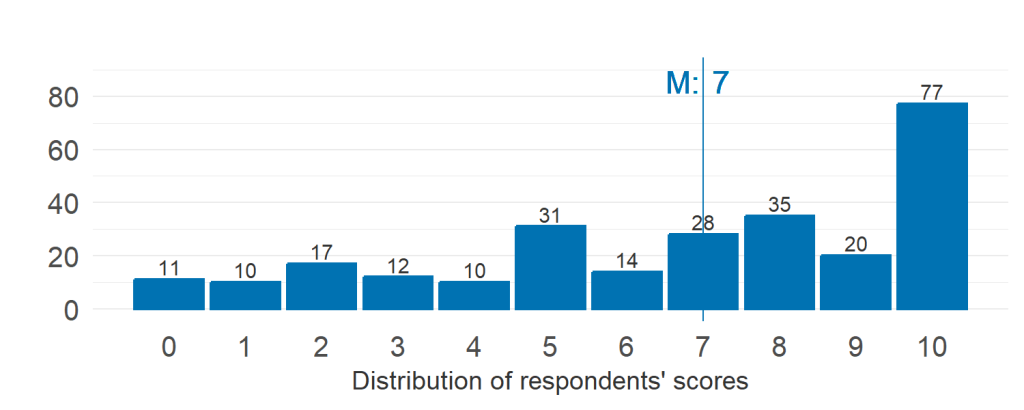
Although this proposal was scored quite positively by respondents as it would be more money without a high impact on our current conference model, a lot of respondents adopted a cautionary tone in their comments. Participants expressed concerns about the ethical implications of a strong reliance on funding from the industry. Some emphasized the potential unreliability of this funding source, which depends on economic fluctuations. Additionally, there were comments about the high pressure it could place on CHI organizers to secure sufficient and reliable sponsorships. In the Zoom sessions, participants representing industry noted that the landscape of sponsorship was changing in the tech industry and that shrinking budgets meant less opportunity for sponsoring academic events. Further, they noted that sponsorship often came from budgets devoted to recruiting activities, which had been frozen in an era of increasing layoffs.
3c. By stopping subsidizing student registrations
Proposal: Stop subsidizing student registrations.
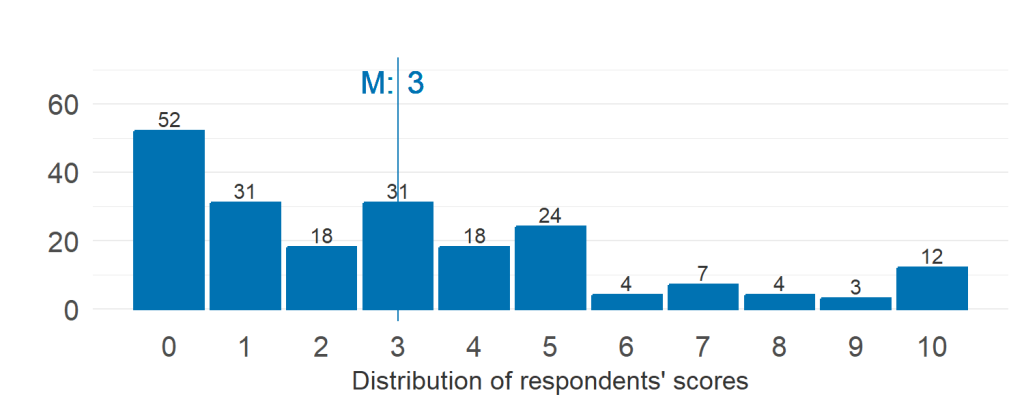
The distribution of respondents’ scores is negatively skewed, reflecting a consensus on the significance of facilitating student access to the conference. Some respondents mention though that a lower level of subsidization may likely not be an obstacle for students’ access overall. In the Zoom sessions, there was a lively conversation on the inequity of subsidizing discounted registrations for students from well-funded institutions by the full-price registrations of non-students from less-well-funded institutions. Furthermore, participants noted that there was too big of an incentive to cheat the system when there are large student discounts.
3d. By cutting the student volunteer (SV) program
Proposal: Cut the student volunteer program.
Respondents’ scores exhibit a balanced distribution regarding this proposal. Comments revealed that it is not clear for all that the cost of the SV program has such a significant share in the conference budget. However, as noted by many respondents, it is not clear how much could be saved by cutting the SV program altogether. SVs undertake tasks that would otherwise require contracting a vendor. Some respondents propose exploring alternatives, such as having SVs contribute a small registration fee, to reduce costs without eliminating the program. Furthermore, concerns were raised about the perceived inequality in accessibility to the SV program, with the current lottery-based selection process seen as a potential barrier for some students. In the Zoom session, participants echoed these benefits, drawbacks, and inequities of the current SV program.
Summary
We would like to thank all the respondents who took the time to provide valuable feedback, and all attendees of the two Zoom sessions who contributed thoughts. We have carefully read and analyzed all the detailed comments. All this feedback will help the Steering Committee propose a new model of CHI to the community, for further discussion and implementation as soon as 2026. Stay tuned for our suggested redesign in Part Four.